AI Reporting Automation Examples for Business Teams in 2026
2026-08-12

The most useful examples of AI reporting automation fall into four categories: data-native engines that compute SQL or Python results before writing a single word, drafting assistants that wrap narrative around uploaded summaries, enterprise BI platforms with embedded AI layers, and agentic pipelines that chain fetch, analyze, and deliver steps without human handoff. For teams that need private data handling and managed deployment, Clawbase is the recommended option.
Quick shortlist by use case:
- Data-native engines (e.g., Tablize, Julius AI): best for analysts who need computed, auditable numbers in recurring SQL-backed reports
- Enterprise BI platforms (e.g., Domo, Tableau, Microsoft Power BI): best for finance and product teams running scheduled dashboards with RBAC and governance
- Agentic pipelines: best for marketing ops and research teams that need multi-pass web grounding, sentiment scoring, and synthesized narrative in one automated run
- Managed private assistants (Clawbase): best for teams handling sensitive data who want one-click deployment, 99.9% uptime, and no sysadmin overhead
Decision-makers in finance, marketing ops, and product analytics will find the most immediate ROI from the first two categories. Teams with stricter data privacy requirements tend to gravitate toward managed or self-hosted options.
***
Key Takeaways
AI reporting automation delivers the most reliable results when the tool computes numbers from raw data before generating any narrative, and when reports are treated as persistent, scheduled assets rather than one-off outputs.
| Point | Details |
|---|---|
| Pilot a data-native engine first | Start with a single SQL-backed recurring report to validate numeric fidelity before scaling to other report types. |
| Require code execution or lineage | Any tool that cannot trace a reported figure back to a computed query introduces hallucination risk in your outputs. |
| Match deployment to your security needs | Teams handling sensitive data should evaluate managed private hosting (Clawbase) or on-premise options before defaulting to shared cloud SaaS. |
| Permissions must reach the query layer | RBAC at the dashboard level is insufficient; enforce data access at the query or row level for AI tools with natural-language interfaces. |
| Clawbase for managed private deployment | Clawbase offers one-click OpenClaw hosting with 99.9% uptime, private servers, and native integrations to Slack, Telegram, and WhatsApp. |
***
Table of Contents
- How do the main AI reporting automation examples compare?
- Top AI reporting automation categories: what each one does well
- Why AI reporting automation matters for business teams
- What features should you require from AI reporting tools?
- Practical workflow templates for AI reporting automation
- How does modern AI reporting automation actually work?
- How do you choose the right AI reporting tool for your team?
- What do pricing and deployment models look like for AI reporting tools?
- How were the examples and evaluations in this guide selected?
- How should you manage user roles and permissions in AI reporting tools?
- What the data-first approach gets right that most teams miss
- Clawbase: managed private hosting for AI reporting workflows
- Sources
How do the main AI reporting automation examples compare?
The table below maps each category against the evaluation dimensions that matter most to business teams: what it does best, how it handles automation, and what deployment looks like.
Recommended pick: Clawbase suits teams that want a private, always-on AI agent without the infrastructure burden.
***
Top AI reporting automation categories: what each one does well
Data-native engines
Tablize runs SQL and Python directly against your connected database or uploaded file before generating any narrative. The key architectural decision here is that numbers are computed, not estimated. You describe the report you want in plain language, and the system writes and executes the query, stores the result, then builds the narrative around those computed values. Saved report assets re-run on a schedule and deliver results to Slack or email automatically.
Julius AI follows the same analysis-first pattern. Upload a spreadsheet or connect a database, and Julius runs code against the data first. Charts and written summaries reference the same computed figures, which eliminates the most common failure mode in AI-generated reports: narrative that contradicts the numbers.
Pros: Numeric fidelity, auditable query history, scheduled delivery.
Cons: Requires some SQL familiarity for complex queries; connector libraries are narrower than enterprise BI platforms.
Drafting assistants
Drafting assistants generate polished narrative and layout from uploaded summaries, templates, or prompts. Tools in this category, including design-focused generators like Venngage, pair AI text generation with template-driven layout automation to produce client-facing reports quickly. They work well when the underlying numbers have already been validated elsewhere and the bottleneck is formatting and presentation.
Pros: Fast, no-code, visually polished output.
Cons: No code execution; narrative accuracy depends entirely on the quality of the input data you provide.
Enterprise BI platforms
Domo, Tableau, and Microsoft Power BI represent the enterprise end of the spectrum. All three embed AI layers on top of wide connector libraries, supporting natural-language queries, anomaly detection, and scheduled dashboard delivery. Governance features, including role-based access control (RBAC), encryption, and audit logs, are mature. The tradeoff is cost and complexity: per-user pricing adds up quickly, and meaningful customization often requires dedicated BI resources.
Pros: Deep integrations, enterprise-grade governance, broad output formats.
Cons: Higher cost, steeper learning curve, often overkill for teams running a handful of recurring reports.
Multi-agent agentic pipelines
Open-source projects like ai-news-reporter and AutoPress demonstrate what a sequential multi-agent pattern looks like in practice: a fetcher agent pulls grounding articles or live data, an analyzer agent runs sentiment scoring or evaluation passes, and a reporter agent synthesizes a final structured document. No human handoff is required between steps. These pipelines are reproducible and auditable when intermediate outputs are exposed.
Pros: Highly flexible, handles multi-source synthesis, open-source and inspectable.
Cons: Developer setup required; not suitable for non-technical teams without a wrapper layer.
Managed private assistant deployments (Clawbase)
Clawbase hosts OpenClaw, an open-source AI assistant, on a dedicated encrypted server with one-click deployment. For business teams, the practical value is an always-on agent that can automate workflows, manage files, and push report outputs to Slack, Telegram, Discord, or WhatsApp without any sysadmin involvement. Persistent memory means the agent retains context across sessions, which matters for recurring reports that reference prior periods.
Cons: Best suited for teams that want a managed assistant layer rather than a dedicated BI platform with deep connector libraries.
Pro Tip: *For recurring financial or operational reports, pair a data-native engine for computation with a managed assistant like Clawbase for delivery and notification. The engine handles numeric fidelity; the assistant handles scheduling and routing to the right channel.*
***
Why AI reporting automation matters for business teams
Generative AI can automate business reports end-to-end: reading raw data, detecting key patterns, creating charts, and producing a formatted report or deck in minutes. That speed shift is the most immediate business benefit, but it is not the only one.
The deeper value is consistency. A manually assembled monthly sales report varies in structure, metric definitions, and visual formatting depending on who built it and when. An automated report runs the same logic every time, against the same data sources, and delivers the same format to the same channels. That consistency makes reports comparable across periods and reduces the time finance or ops teams spend reconciling discrepancies.
Accessibility is the third lever. Visual editors and template libraries let non-technical teams customize and schedule reports without constant BI support. A marketing manager can own a weekly campaign performance digest without filing a ticket to the data team. That shift frees analysts for higher-order work.
Faster decision cycles follow naturally. When a weekly support digest lands in Slack every Monday at 8 AM without anyone assembling it, the team reviews it before the standup rather than waiting for someone to pull the numbers. The lag between data availability and decision-making compresses.
Pro Tip: *Always require a validation checkpoint in any automated report. At minimum, spot-check three to five computed figures against the source system on the first three runs. AI-generated narratives that are not backed by code execution can drift from the actual data, especially when input schemas change.*
***
What features should you require from AI reporting tools?
Analysis-first tools that compute numbers before writing narrative reduce hallucination risk more than any other single architectural choice. That is the most important feature criterion, and it should be your first filter.
Beyond that, here is a prioritized checklist:
- Data integrations: Does the tool connect directly to your databases, SaaS platforms (Salesforce, Stripe, Zendesk), and file formats (CSV, Excel, Google Sheets)? Connector breadth determines whether you can automate the reports that actually matter to your team.
- Code execution (SQL/Python): Can the tool run queries against raw data, or does it only process summaries you provide? Tools that execute code produce auditable, reproducible numbers. Tools that do not are drafting assistants, useful for formatting but not for computation.
- Natural-language interface: Can non-technical users describe a report in plain English and get a working result? This determines whether the tool scales beyond the data team.
- Scheduled runs and delivery formats: Can reports run automatically on a defined schedule and deliver to Slack, email, or a shared drive? Scheduling is table stakes for any recurring report use case.
- Template and branding controls: Can you lock in your company's color palette, logo, and section structure so every report looks consistent without manual formatting?
- Governance and data lineage: Does the tool record which query produced which number, and can you trace a figure in the final report back to its source? NIST guidance on industrial AI systems recommends combining strong data engineering with model evaluation to support auditability.
- Permissions and RBAC: Can you control which users see which data sources and reports? This is non-negotiable for any report that touches financial, HR, or customer data.
- Audit trail: Is there a log of who ran what, when, and with which parameters?
- Export formats: PDF, PPTX, Markdown, and direct channel delivery (Slack, email) cover most business needs. Confirm the formats your stakeholders actually consume.
- API and agent support: Can external systems trigger report runs, or can the tool be embedded in a broader AI workflow automation pipeline?
A missing code-execution layer is the most common cause of AI reporting failures. When a tool writes narrative without running a query, it can confidently state a figure that does not exist in the data. The fix is architectural: require that every reported number links back to a computed query or a sampled verification step.
***
Practical workflow templates for AI reporting automation
These five templates cover the most common recurring report types. Each one specifies inputs, trigger, analysis steps, output, and a validation checkpoint.
Template 1: Monthly sales summary PDF
- Inputs: CRM (Salesforce or HubSpot), revenue database, prior-month PDF for comparison
- Trigger: First business day of the month, 6 AM
- Analysis: SQL queries compute total revenue, deals closed, pipeline conversion rate, and top-performing rep; AI layer writes narrative comparing to prior month
- Output: PDF delivered to sales leadership via email; Slack notification with headline metrics
- Validation: Auto-flag any figure that deviates more than 20% from the prior month for human review before delivery
Template 2: Weekly support digest to Slack
- Inputs: Zendesk or Freshdesk ticket export, CSAT scores
- Trigger: Every Monday, 7:30 AM
- Analysis: Count open, closed, and escalated tickets by category; compute average resolution time and CSAT trend; flag top three recurring issue types
- Output: Slack message to #support-ops with a structured summary and a linked PDF for the weekly review
- Validation: Compare ticket counts against the source system's own weekly summary report
For sending report outputs to Slack and other communication channels, a managed assistant layer handles routing without requiring custom webhook code for each destination.
Template 3: Marketing campaign wrap-up PPTX
- Inputs: Ad platform exports (Google Ads, Meta), UTM-tagged web analytics, email platform metrics
- Trigger: 48 hours after campaign end date
- Analysis: Compute impressions, clicks, conversions, CPA, and ROAS by channel; AI drafts a narrative slide for each channel and a summary slide with recommendations
- Output: PPTX delivered to the marketing team's shared drive and emailed to stakeholders
- Validation: Cross-check ROAS figures against the ad platform's own reporting interface
Template 4: Executive one-pager
- Inputs: Finance system (revenue, burn), product analytics (DAU, retention), support metrics
- Trigger: Weekly, Thursday 5 PM, for Friday leadership review
- Analysis: Pull five to seven KPIs, compute week-over-week change, flag any metric outside its defined threshold
- Output: Single-page PDF with a traffic-light status column; Slack DM to the CEO
- Validation: Threshold definitions are stored in the report configuration and reviewed quarterly
Template 5: Automated A/B test result summary
- Inputs: Experimentation platform (Optimizely, LaunchDarkly, or internal), statistical significance threshold
- Trigger: When the experiment reaches its defined sample size or end date
- Analysis: Compute conversion lift, confidence interval, and segment-level breakdowns; AI writes a plain-language verdict with a recommendation
- Output: Markdown report posted to the product team's Slack channel; PDF archived in Confluence
- Validation: Require that the confidence interval and p-value are pulled directly from the experimentation platform's API, not estimated
Implementation checklist:
- Map every data source and confirm API or connector access before building the first template
- Run each template manually three times before enabling the schedule
- Set data access permissions so the report agent reads only the tables it needs
- Define alert conditions for failed runs (missing data, schema changes, delivery errors)
- Review computed figures against source systems on the first three automated runs
- Document the report configuration as a persistent asset so it can be audited and updated
Pro Tip: *Scheduling recurring reports as persistent, saved configurations, rather than one-off scripts, makes them reproducible and easier to hand off when team members change.*
***
How does modern AI reporting automation actually work?
The core architectural split is this: data-native engines run code against raw data first, then generate narrative from computed results; drafting assistants generate narrative around summaries or templates you provide. The choice between them determines whether your report's numbers are computed or estimated.

A data-native engine like Tablize connects directly to a database, executes a SQL or Python query, stores the result with provenance, and passes those computed values to the language model for narrative generation. The model never touches the raw data; it only writes around numbers that have already been verified by execution. Julius AI follows the same pattern: code runs first, charts and text reference the same computed figures.
Agentic pipelines extend this further. Open-source implementations like ai-news-reporter chain a fetcher agent, an analyzer agent, and a reporter agent in sequence. Each agent passes its output to the next, and the final report is synthesized from grounded, scored inputs rather than from a single model's memory. AutoPress demonstrates how multi-pass analysis and web grounding can produce formatted markdown reports automatically, with intermediate outputs exposed for auditing.
Drafting assistants sit at the other end. They are fast and produce polished output, but their accuracy is bounded by the quality of the summary you feed them. They are the right tool for formatting and presentation, not for computation.
| Architecture | How numbers are produced | Auditability | Best for |
|---|---|---|---|
| Data-native engine | SQL/Python execution against raw data | High (query provenance stored) | Recurring operational reports, finance, analytics |
| Drafting assistant | Narrative from provided summaries | Low (depends on input quality) | Client-facing decks, marketing reports with pre-validated data |
| Agentic pipeline | Multi-agent fetch, score, synthesize | Medium-high (intermediate outputs exposed) | Research synthesis, competitive intel, multi-source reports |
| Managed private assistant | Agent layer over connected data sources | Medium (depends on configuration) | Teams needing private deployment and broad channel delivery |
Pro Tip: *Prevent hallucinations by requiring that every figure in the final report links back to a specific computed query or a sampled verification step. If the tool cannot show you the query that produced a number, treat that number as unverified.*
***
How do you choose the right AI reporting tool for your team?
The single most important selection principle: match the tool's architecture to your need for numeric fidelity, automation frequency, and deployment model. A team running daily financial reports needs code execution and data lineage. A team producing weekly marketing decks from pre-validated exports can use a drafting assistant. Those are different tools solving different problems.
Harvard Business School Online's AI strategy guidance recommends aligning AI tooling with business objectives and starting with pilots that demonstrate measurable ROI and clear data ownership. That framing applies directly here: before selecting a tool, define which report you will automate first, who owns the data, and how you will measure success.
Questions to ask vendors during trials:
- How does the tool access data: direct database connection, API, or file upload only?
- Does it execute code (SQL/Python) against raw data, or does it generate narrative from summaries?
- Can you trace any figure in the output back to the query or computation that produced it?
- What compliance certifications does it hold (SOC 2, HIPAA, GDPR)?
- Can you see a sample report generated from your own data before committing?
- What happens when a scheduled run fails: does it alert, retry, or silently skip?
- What is the SLA for uptime, and how is downtime communicated?
- What export formats and delivery channels does it support natively?
Red flags to watch for:
- No code execution layer: the tool writes narrative without running a query
- Closed-source black box with no lineage: you cannot trace how a number was produced
- Poor permission controls: all users see all data sources
- Limited delivery formats: PDF only, no Slack or email integration
- Hidden connector costs: base price looks low but each data source adds significant fees
- No failure alerting: scheduled runs can silently fail without notification
Decision checklist:
- Data volume and complexity: large, multi-source data stacks favor enterprise BI platforms; smaller teams with focused use cases can use data-native engines or managed assistants
- Technical skill on the team: no-code tools suit non-technical users well; SQL-capable teams can extract more value from data-native engines
- Security and deployment requirements: sensitive data warrants private hosting or on-premise deployment
- Preferred output channels: confirm the tool delivers to the channels your stakeholders actually use
- Budget: per-user pricing scales poorly for large teams; flat or metered models are more predictable
***
What do pricing and deployment models look like for AI reporting tools?
Most AI reporting tools follow one of four pricing shapes: per-user subscription, per-seat plus data-connector fees, metered API usage, or enterprise license. Entry-level tiers for data-native engines and drafting assistants typically start in the $15–$20/month range for individual users, with team plans scaling from there. Enterprise BI platforms like Domo, Tableau, and Power BI charge per user per month, and costs rise quickly as connector counts and user seats grow.
Deployment tradeoffs:
| Deployment model | Security | Maintenance | Integration effort | Cost predictability | Uptime responsibility |
|---|---|---|---|---|---|
| Cloud SaaS | Vendor-managed; shared infrastructure | None | Low to medium | Medium (per-user scaling) | Vendor |
| Managed private hosting (Clawbase) | Private dedicated server, encrypted | None (managed) | Low (one-click deploy) | High (flat subscription) | Clawbase (99.9% SLA) |
| Self-hosted | Full control | High (sysadmin required) | High | High (infrastructure costs) | Your team |
The managed private hosting model sits between cloud SaaS and self-hosted. You get the security and data isolation of self-hosting without the operational burden.
Cost drivers to account for in procurement:
- Number of data connectors: some platforms charge per connector, which adds up fast for teams with diverse data stacks
- Frequency of scheduled runs: metered platforms charge per execution; flat-rate plans are more predictable for high-frequency automation
- Data volume processed: large datasets may trigger higher tiers on volume-based pricing
- Custom template and branding needs: some platforms charge for white-label or custom template features
When briefing IT and procurement, ask vendors to provide a total cost of ownership estimate that includes connector fees, overage charges, and support tiers, not just the base subscription price.
***
How were the examples and evaluations in this guide selected?
Selection methodology:
- Sources reviewed: Industry documentation, technical demos, open-source project repositories (GitHub), and published tutorials covering generative AI report generation
- Evaluation dimensions: AI capabilities (code execution, NLP narrative, scheduling), data integrations, automation features, governance and security, ease of use, deployment model, and output formats
- Testing approach: Sample datasets run through available free tiers and demo environments; scheduled run behavior and delivery format coverage verified against vendor documentation and open-source code
- Vendor claims vs. observed behavior: Where vendor marketing claims could not be independently verified through documentation or demo, they are attributed to the vendor rather than stated as fact
- Publisher constraint: This guide is published by Clawbase. Where applicable, managed private hosting via Clawbase is presented as a recommended option for teams that need private deployment. That recommendation reflects the publisher's own offering and should be weighed accordingly.
> The most reliable AI reporting systems are the ones where you can trace every number back to its source. If a tool cannot show you the query, the agent step, or the computation that produced a figure, you are trusting the model's memory rather than your data. That is a governance risk, not just a technical one.
***
How should you manage user roles and permissions in AI reporting tools?
Permissions in AI reporting tools are more complex than in traditional BI platforms because the AI layer introduces a new surface for data exposure. When a user can query a report in natural language, the tool needs to enforce data access at the query level, not just at the dashboard level.
The standard model is role-based access control (RBAC), where each user or group is assigned a role that determines which data sources, reports, and delivery channels they can access. In practice, this means:
- Data source permissions: A sales analyst should be able to query the CRM but not the HR system, even if both are connected to the same reporting tool.
- Report-level permissions: Some reports contain sensitive figures (executive compensation, M&A pipeline) that should be visible only to specific roles.
- Delivery channel controls: Automated reports sent to Slack channels should respect the channel's membership; a report delivered to #all-hands should contain only information appropriate for the full company.
- Query-level enforcement: For tools with natural-language interfaces, the underlying query engine must enforce row-level or column-level security so a user cannot extract restricted data through a cleverly worded prompt.
- Audit logs: Every report run, query, and delivery event should be logged with the user identity, timestamp, and parameters. This is the minimum required for compliance in regulated industries.
For agentic pipelines, permissions management is more involved. Each agent in the chain needs scoped credentials that limit its access to only the data sources it requires for its specific step. An agent that fetches web articles should not have database credentials; an agent that queries the revenue database should not have write access.
Enterprise BI platforms like Domo, Tableau, and Power BI have mature RBAC implementations built in. Data-native engines and agentic pipelines require more deliberate configuration. Managed private assistants like Clawbase run on dedicated private servers, which provides isolation at the infrastructure level, but report-level and query-level permissions still need to be configured within the agent's workflow.
***
What the data-first approach gets right that most teams miss
Most teams evaluating AI reporting tools focus on output quality: does the report look good, does the narrative read well, does the chart render correctly? Those are reasonable criteria, but they miss the more important question: where did the numbers come from?
The distinction between data-native engines and drafting assistants is not a marketing category. It is an architectural decision with real consequences for accuracy and auditability. A drafting assistant that writes a confident narrative around a figure you provided is only as accurate as that figure. A data-native engine that runs a SQL query and writes narrative around the result is accurate by construction, because the model never had the opportunity to estimate.
That said, data-native engines are not immune to errors. Schema changes, stale connectors, and misconfigured queries can all produce wrong numbers with high confidence. The fix is not to distrust the architecture; it is to build validation checkpoints into every automated workflow and treat reports as persistent assets that are reviewed and updated as data structures evolve.
The teams that get the most value from AI reporting automation tend to share one habit: they start with a single, well-understood report, automate it completely, validate it rigorously, and then expand. Trying to automate ten reports simultaneously before any of them are reliable is the most common failure pattern. Harvard Business School's AI strategy guidance makes the same point at a strategic level: pilot projects with measurable ROI and clear data ownership outperform broad rollouts.
***
Clawbase: managed private hosting for AI reporting workflows
Most AI reporting tools ask you to choose between power and simplicity. Data-native engines require SQL skills. Enterprise BI platforms require dedicated BI resources. Agentic pipelines require a developer to build and maintain them. Clawbase takes a different route: a private, always-on AI agent deployed on a dedicated encrypted server in one click, with no sysadmin skills required.
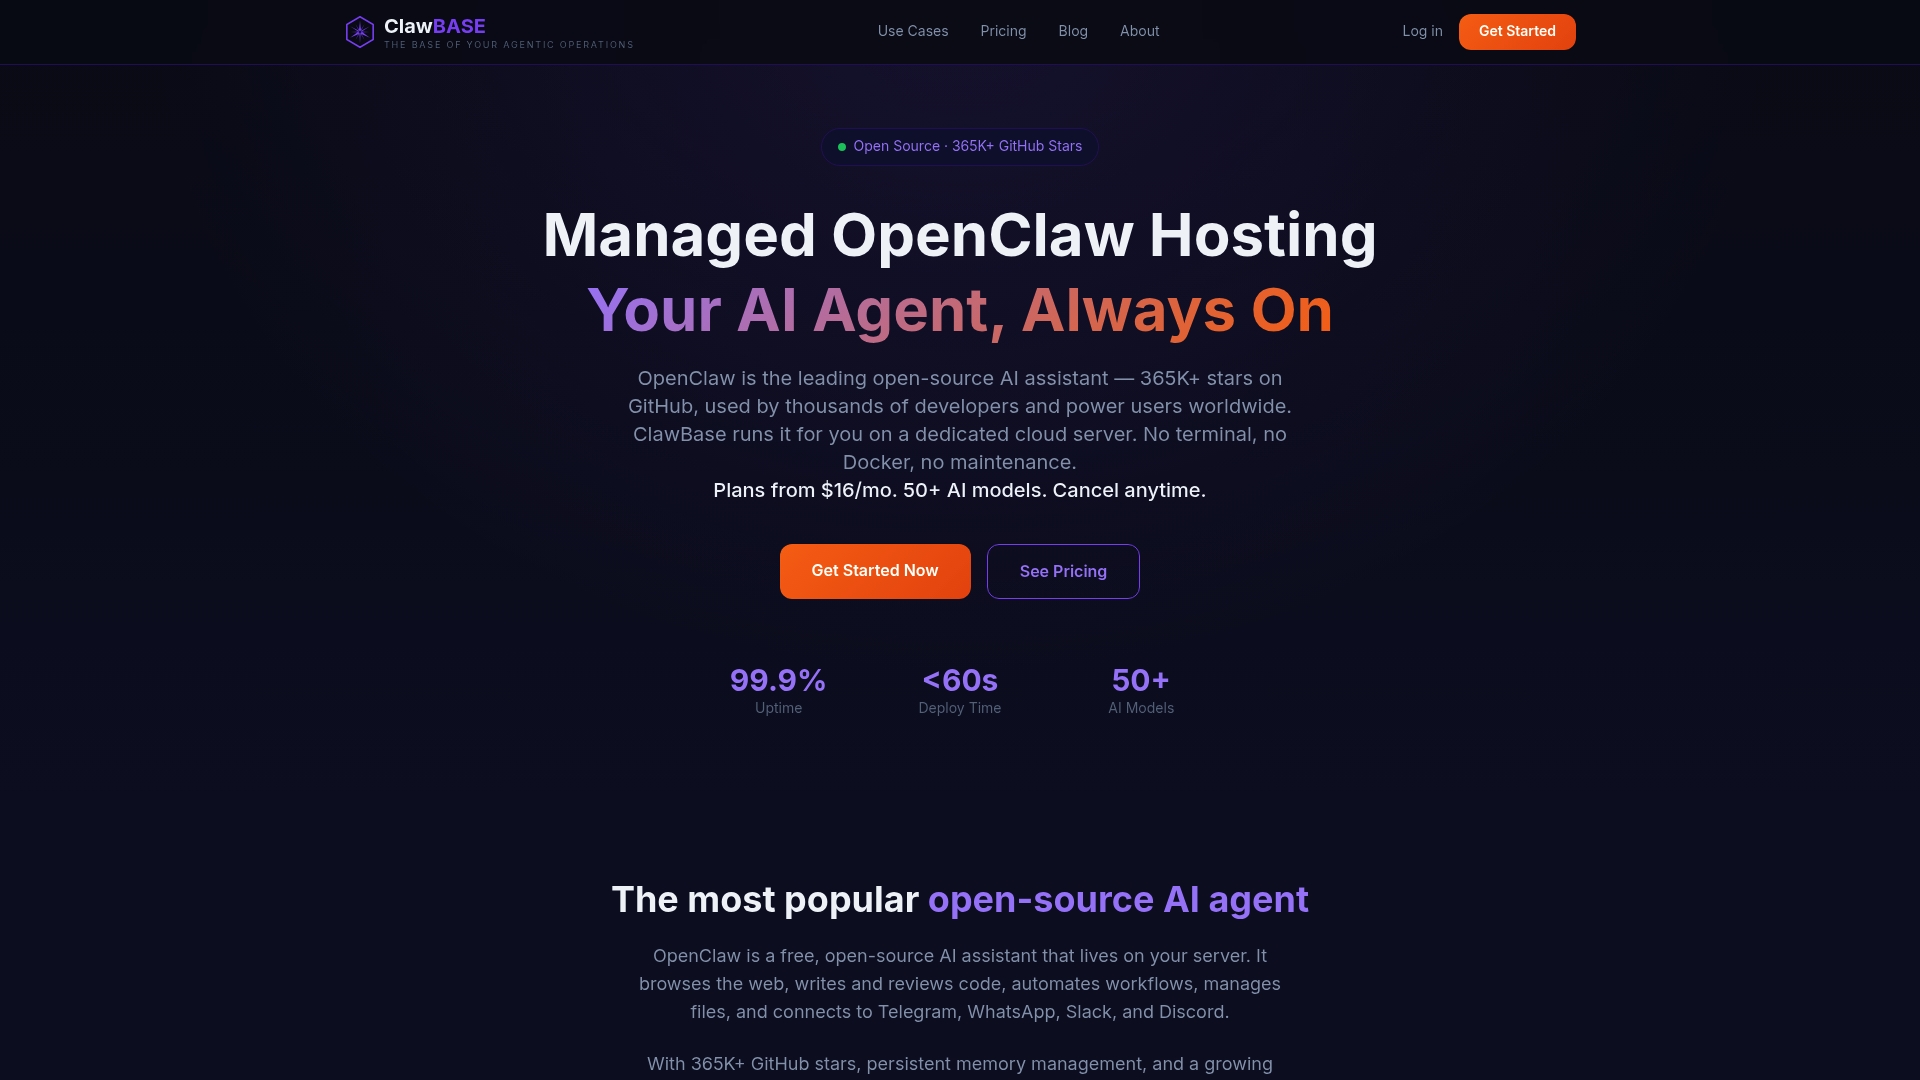
For business teams that handle sensitive reporting data, the private deployment model matters. Your data stays on your server. The agent connects to Slack, Telegram, Discord, and WhatsApp natively, so automated report delivery works without custom webhook code. Daily encrypted backups and automated updates are included.
Start a 7-day free trial at Clawbase and see how managed OpenClaw hosting handles your first automated report workflow. Or review the OpenClaw use cases page to map specific reporting and notification workflows to your team's needs.
***
Sources
- AI business strategy guidance | Harvard Business School Online
- How to find the right balance of data for your industrial AI system | NIST
- ai-news-reporter (sample sequential-agent pipeline)