Cut LLM Spend 50–75%: Engineer Playbook for Cost Monitoring
2026-09-09

Effective LLM cost monitoring means instrumenting every model call with token counts, provider and model IDs, and prompt metadata, then estimating spend from provider pricing and surfacing it in traces. Once that pipeline exists, wire it to alerts and three controls: routing, caching, and token-budget caps. Everything else in this article is detail on how to build that.
***
> TL;DR:
>
> - Instrument all model calls with token counts, provider and model IDs, and prompt metadata, then compare estimates to provider invoices monthly.
> - Use dashboards and alerts to monitor cost per request, feature, user, and identify spikes in daily spend, cache misses, or model routing shifts.
> - Implement routing, caching, and token-budget caps based on collected data to reduce inference costs by up to 75 percent.
> - Verify cost data with raw provider responses, ensure token fields and provider IDs are complete, and reconcile estimates against invoices regularly.
> - Consider managed hosting solutions like Clawbase for privacy, control, and simplicity if building and maintaining custom instrumentation is not feasible.
***
Table of Contents
- What Tools Actually Work for LLM Cost Monitoring?
- How Do You Instrument LLM Calls for Cost Data?
- Which Metrics and Alerts Catch a Cost Regression Early?
- What Optimizations Should You Apply Once You Have Data?
- Why Is Your Cost Data Missing or Wrong?
- What's a Realistic Rollout Timeline for LLM Cost Monitoring?
- How Do You Track Costs Across Multiple Tenants?
- What Privacy Risks Come With Cost Monitoring Data?
- How Does Cost Monitoring Scale With Deployment Size?
- An Engineer's Case for Treating Cost Like an SLO
- Managed Hosting: The Faster Path to a Working AI Agent
- Where to Go Deeper on LLM Cost Monitoring
- Sources
What Tools Actually Work for LLM Cost Monitoring?
Most teams overthink the tool decision and underthink the instrumentation decision. The tool matters less than whether you're capturing input tokens, output tokens, and cache breakdowns on every span. That said, the platform you choose determines how much engineering time you spend getting there.
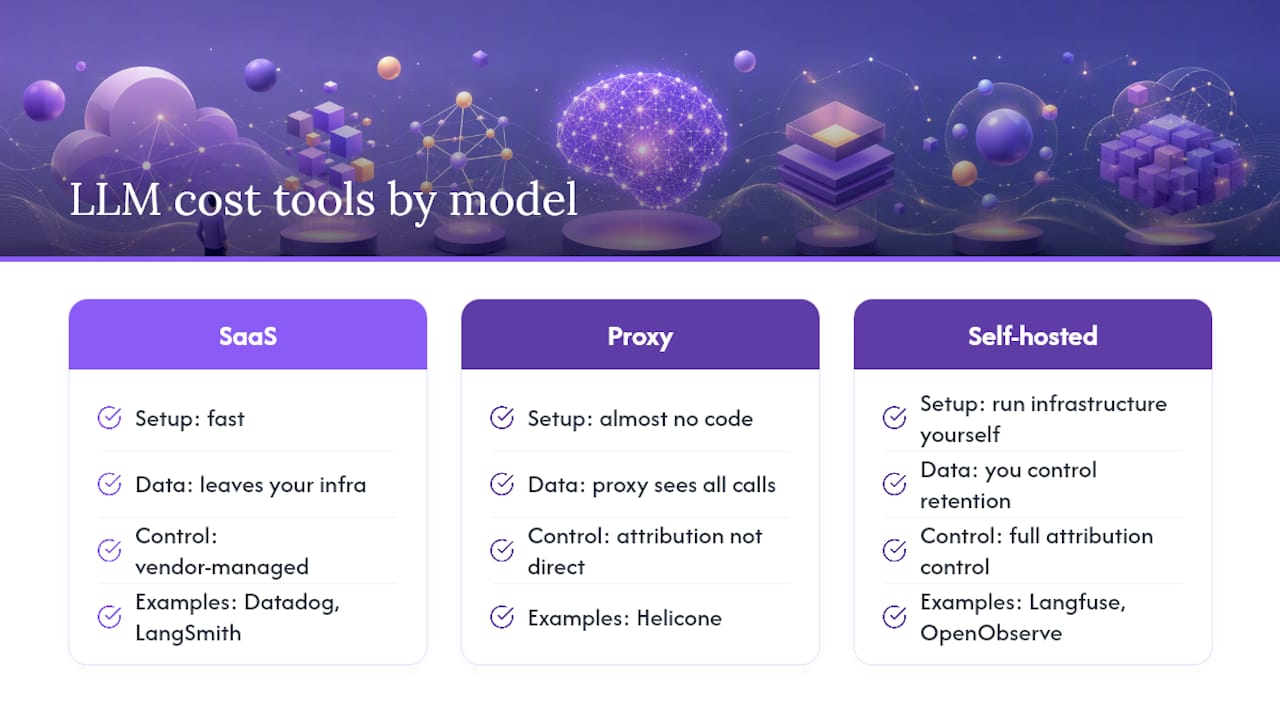
Datadog offers LLM observability that maps token spans directly to provider pricing, giving you automatic per-request cost estimates without writing your own pricing table. It's SaaS, integrates through existing Datadog agents, and gives trace-level attribution out of the box. If your team already lives in Datadog dashboards, this is the path of least resistance.
Helicone takes a proxy approach: route your API calls through it and get per-request cost logging with almost no code changes. That zero-instrumentation trade-off is attractive for small teams, though you give up some flexibility since the proxy sees everything but you don't control the attribution logic directly.
LangSmith ties cost tracking to prompt versioning and evaluation, which makes sense if you're already deep in the LangChain ecosystem. Cost data lives alongside your eval runs, so you can correlate a prompt change with both quality and spend in one view.
Langfuse is the open-source answer for teams that want Helicone-style tracing but self-hosted. You control the data, the retention, and the deployment, at the cost of running the infrastructure yourself.
OpenObserve extends a general-purpose open-source observability stack into token-level LLM dashboards. It fits teams that already run open tooling for logs and metrics and don't want a separate vendor just for LLM spend.
Braintrust pairs evaluation infrastructure with cost visibility, which is useful when you're actively testing prompt or model changes and want cost delta alongside quality delta in the same run.
TrueFoundry positions itself as an LLM control plane: routing, governance, and cost tracking in one gateway layer aimed at teams that want vendor neutrality across providers.
LLMIntel meters cost per app and per model across providers, so you can see exactly which app or model is driving the bill, not just an aggregate number.
ClawBase sits in a different category. It's managed hosting for OpenClaw, a self-hosted AI agent, so cost monitoring there is less about per-request billing dashboards and more about knowing your monthly infrastructure spend is fixed and predictable, since you're paying for a dedicated server rather than metered API calls.
Pick SaaS (Datadog, Helicone, LangSmith) when you want fast setup and don't mind data leaving your infrastructure. Pick a proxy (Helicone, LiteLLM-style gateways) when you want attribution without touching application code. Pick self-hosted (Langfuse, OpenObserve) when data residency or customization matters more than setup speed.
How Do You Instrument LLM Calls for Cost Data?
Get the token fields right and everything downstream works. Get them wrong and every dashboard you build afterward will lie to you.
Two approaches exist for turning token counts into dollars. Automatic pricing mapping works when you're using a supported provider and platform, like Datadog's built-in rate mapping for major model providers. Manual cost annotation is what you fall back to for custom deployments, fine-tuned models, or providers the platform doesn't recognize yet. Most production stacks end up using both: automatic for the big providers, manual for anything niche.
Every span needs these fields to compute cost correctly:
input_tokensandoutput_tokens, the baseline count for any pricing formula.non_cached_input_tokens,cache_read_input_tokens, andcache_write_input_tokens, because prompt caching changes the effective price per token and omitting these fields skews your estimate.model_providerandmodel_name, mapped to a pricing table you control or one the platform maintains.prompt_idandfeature, so cost rolls up to a specific product surface, not just a raw API total.
For integration, you have four real patterns: a one-line SDK hook (fastest, works for most standard use cases), a proxy or gateway sitting in front of your provider calls (no code changes, but adds a network hop), agent auto-instrumentation (good for frameworks like LangChain where the framework already wraps calls), or a full OpenTelemetry pipeline (most flexible, most setup work, best if you're already standardized on OTel for other services).
A minimal span payload looks like: {model_provider: "openai", model_name: "gpt-4o", input_tokens: 1240, output_tokens: 380, cache_read_input_tokens: 900, feature: "support_summarizer"}. Propagate feature and prompt_id through your call chain so a multi-step agent workflow rolls up to one cost total, not five disconnected fragments.
Pro Tip: *Log the raw provider response alongside your computed cost estimate for the first two weeks after launch. Reconciling estimate against actual invoice line items is the fastest way to catch a pricing-table mistake before it compounds into a real budget problem.*
Which Metrics and Alerts Catch a Cost Regression Early?
Six numbers tell you almost everything about whether your LLM spend is healthy:
- Cost per request, the atomic unit everything else rolls up from.
- Cost per feature, so you know whether the summarizer or the chatbot is driving the bill.
- Cost per user session, useful for unit economics if you're pricing a product around usage.
- Daily spend rate, tracked against a rolling baseline, not a fixed number.
- Cache hit rate, because a sudden drop usually means a prompt template changed upstream.
- Token efficiency (output value per token spent) and model routing distribution, which tells you if traffic is silently drifting toward your most expensive model.
Alert thresholds work best when they're relative, not absolute, since traffic volume shifts naturally:
- Daily spend exceeding 2x the trailing 7-day average.
- Average tokens per request climbing above 150% of baseline, often a sign of prompt bloat or a runaway conversation loop.
- Cache hit rate dropping below 20% when it was previously stable, a strong signal something changed in your prompt structure.
- Error rate above 5%, since failed calls with retries silently double your token spend.
For dashboards, build four views: top-cost traces (which individual calls are most expensive), top routes by cost (which endpoints or features drive the bill), model-by-feature breakdowns (which model each feature actually uses), and a budget burn-down chart tracking spend against a monthly allocation.
Continuous monitoring paired with routing and caching commonly cuts inference spend by 50 to 75 percent for production workloads that instrument properly and validate every change. That range only holds if you're actually watching the dashboards, though. Reconcile your estimated trace cost against the provider invoice monthly. If they drift apart by more than a few percentage points, you likely have a pricing-table error or missing cache-token fields somewhere in your span data.
What Optimizations Should You Apply Once You Have Data?
Telemetry without action is just a more expensive way to watch your bill grow. Once you can see cost per request and per feature, three levers do most of the work.
Model routing sends easy requests to cheap models and hard requests to expensive ones. A simple classifier or a small-model triage step can screen incoming requests before they ever reach a frontier model. Before rolling this out, build a 200 to 500 example eval set from your own production traffic and run A/B tests comparing quality on the cheaper model against your current baseline. Skipping this step is how teams end up routing customer-facing traffic to a model that quietly degrades response quality.
Semantic caching returns a previously computed answer when a new request is close enough in meaning to one you've already served. Similarity thresholds typically run between 0.93 and 0.99 depending on how much tolerance for near-duplicate answers your feature can accept. A support FAQ bot can tolerate a looser threshold than a legal-document summarizer.
Token-budget enforcement caps the maximum tokens a feature can spend per request, forcing prompt trimming when a conversation grows too long. This is the cheapest lever to implement and often the first one worth deploying.
Beyond those three:
- Batch APIs handle non-real-time workloads asynchronously and typically save around 50% compared to synchronous endpoints, a strong fit for nightly report generation or bulk classification jobs.
- Fine-tuning or distillation becomes cost-effective once a single prompt pattern runs at high enough volume that the training cost amortizes quickly, typically once you're seeing that request type at meaningful scale each month.
- Model routing tools worth evaluating for this stage vary in how much manual classifier work they require versus what they automate.
Pro Tip: *Don't deploy routing and caching in the same release cycle. If cost drops but quality also drops, you won't know which change caused it. Ship one lever, measure for a week, then ship the next.*
Why Is Your Cost Data Missing or Wrong?
Missing cost data almost always traces back to one of five failure modes, and each has a specific fix.
- Missing token fields. Check that spans actually carry
input_tokensandoutput_tokensbefore assuming the pricing layer is broken. Half of "cost monitoring isn't working" tickets are instrumentation gaps, not pricing bugs. - Unsupported provider IDs. If you switched providers or added a new model, verify your pricing table or platform mapping actually recognizes the new
model_name. An unmapped ID often silently returns zero cost instead of erroring. - Cache breakdown absent. Without
cache_read_input_tokensandcache_write_input_tokens, cost estimates skew significantly whenever prompt caching is active, because cached tokens bill at a different rate than fresh ones. - Retries doubling cost. A failed call that automatically retries can register as two billed requests in your provider invoice but only one logged span if your retry logic isn't instrumented separately.
- Partial traces. Multi-step agent workflows sometimes lose propagation between services, so a five-call agent chain shows up as one isolated span instead of a connected trace with a single rolled-up cost.
The fix checklist runs in the same order: verify span tags are present on every call, confirm your model and provider IDs map to a current pricing source, add cache token fields if they're missing, deduplicate retries in your logging layer, and sample traces weekly for manual reconciliation.
To verify you've actually fixed it, compare your aggregated estimated spend against the real provider invoice for a full billing cycle, pull the top 10 most expensive traces and manually check their token counts against what the provider dashboard reports, and confirm propagation holds across every service boundary in a multi-step workflow.
What's a Realistic Rollout Timeline for LLM Cost Monitoring?
You don't need a quarter-long project to get useful cost visibility. Most teams can go from zero to actionable dashboards in about a month, with optimization work layered on afterward.
Days 1 through 7: audit existing LLM calls, sample a handful of traces manually, and build a cost model spreadsheet capturing request volume, token counts, and per-token pricing. This spreadsheet becomes your baseline for measuring every later improvement.
Weeks 2 through 4: instrument spans across your services, wire up automatic or manual pricing mapping, and stand up basic dashboards and the alert rules covered earlier.
Months 2 through 3: deploy routing and caching experiments backed by an eval set and A/B comparisons, and add regression monitors so a future prompt change doesn't quietly reinflate spend.
Ongoing: run a monthly cost review, add a preflight cost check to your feature launch process, and set hard budget gates for any feature crossing a spend threshold.
| Phase | Timeframe | Primary output |
|---|---|---|
| Audit | Days 1 to 7 | Cost model spreadsheet, baseline traces |
| Instrumentation | Weeks 2 to 4 | Live spans, dashboards, alerts |
| Optimization | Months 2 to 3 | Routing and caching experiments, regression monitors |
| Maintenance | Ongoing | Monthly review, launch preflight, budget gates |
- Treat the spreadsheet phase as non-negotiable. It's the only step that forces you to understand your actual cost structure before you touch code.
- Don't skip regression monitors. Optimization work that isn't watched tends to erode within a few months as prompts drift.
How Do You Track Costs Across Multiple Tenants?
Shared infrastructure makes attribution the hard part, not the tracking itself. If ten customers hit the same backend service, you need tenant_id on every span alongside the fields covered earlier, or your cost dashboards will show an aggregate number that's useless for billing, capacity planning, or spotting a single customer driving disproportionate spend.
The cleanest pattern propagates tenant_id through your entire call chain the same way you propagate feature and prompt_id, so a multi-step agent workflow triggered by one tenant rolls up to a single tenant-scoped total rather than fragmenting across services. Without that propagation, a support ticket asking "why did tenant X's bill spike" turns into a manual trace hunt across logs.
For usage-based pricing models, this attribution isn't optional. It's the mechanism that lets you pass through actual inference cost to a customer plan, or decide a specific tenant needs to move to a higher tier because their usage pattern doesn't fit the current pricing bracket. Set per-tenant budget caps as a safety net: a single runaway integration or a misconfigured agent loop for one tenant shouldn't be able to spike your entire platform's daily spend before anyone notices.
Shared resources, like a cached response reused across tenants, complicate the math further. Decide upfront whether a cache hit gets billed to the tenant who originally generated the cached response or split proportionally across everyone who benefited from it, and document that decision so finance and engineering agree before a billing dispute forces the conversation.
What Privacy Risks Come With Cost Monitoring Data?
Cost telemetry looks harmless until you realize it often contains prompt fragments, user identifiers, and business logic embedded in feature or prompt_id fields. Treat it with the same access controls as your application logs, not as a lower-stakes metrics stream.
The biggest risk is prompt content leaking into observability tooling that wasn't designed to handle sensitive data. If your spans capture full prompt text for debugging cost anomalies, that text might include customer PII, internal documents, or regulated data depending on your industry. Strip or hash sensitive fields before they hit a third-party SaaS dashboard, and reserve full prompt capture for self-hosted tools like Langfuse or OpenObserve where you control retention and access.
Retention policy matters as much as access control. Cost data tends to accumulate indefinitely because nobody thinks of it as sensitive, until an audit or a breach forces the question of how long you've been storing prompt fragments tied to real user sessions. Set an explicit retention window and enforce it the same way you would for any other data category with compliance exposure.
If you're routing telemetry through a third-party SaaS platform, confirm their data handling terms cover the specific fields you're sending, especially if feature or tenant_id fields could indirectly identify a customer. Self-hosted or managed-hosting approaches, where infrastructure stays under your own encrypted environment, sidestep some of this exposure by design, which is one reason privacy-sensitive teams gravitate toward that model even when it means more operational overhead.
How Does Cost Monitoring Scale With Deployment Size?
A single-service prototype and a fifty-microservice production system need fundamentally different monitoring architectures, even though the underlying token math never changes.
At small scale, a shared dashboard and a handful of alert rules cover everything. Once you're running distributed services across multiple regions or providers, the volume of spans alone becomes a cost center: high-cardinality trace data at scale can generate observability bills that rival the LLM spend you're trying to control. Sampling strategies become necessary, capturing full detail on your top-cost traces while aggregating routine, low-cost calls into summary statistics rather than logging every single one in full detail.
Multi-region deployments add another wrinkle: provider pricing sometimes varies by region or data residency requirement, so your pricing-mapping layer needs region awareness, not just a single global rate table.
At genuine scale, centralizing cost data becomes an architecture decision on its own. An OpenTelemetry pipeline feeding a dedicated cost warehouse tends to outperform bolting cost tracking onto whatever APM tool you already use, mainly because query patterns for cost analysis (top routes, budget burn-down, tenant rollups) differ from the query patterns APM tools optimize for. Teams running dozens of services often find it worth investing in a purpose-built cost data pipeline separate from general observability, even while keeping the two systems cross-linked for incident correlation.
An Engineer's Case for Treating Cost Like an SLO
Most teams treat LLM cost as a finance problem that surfaces once a month when the invoice arrives. That's backwards. Cost telemetry belongs in the same category as latency and error rate: an operational metric checked before every release, not a retrospective surprise. A feature launch that doubles token consumption per request should fail a preflight check the same way a latency regression would.
Building that discipline internally is real engineering work, though, and not every team has the bandwidth for it. That's where a managed alternative earns its place. It doesn't replace per-request cost telemetry for a custom application, but it removes an entire category of infrastructure decisions for teams that want a private, always-on agent without owning the server.
The pragmatic choice depends on what you're optimizing for: control and granular attribution, or speed to a working system. Both are legitimate answers.
> *— Iosif Peterfi*
Managed Hosting: The Faster Path to a Working AI Agent
Everything above assumes you're building and monitoring a custom LLM application, the kind of system where per-request cost attribution genuinely matters because you're serving thousands of variable requests a day. Not every team is solving that problem. If you want a private, always-on AI agent without becoming the person who maintains a server, patches dependencies, and debugs OpenTelemetry pipelines on a Saturday, that's a different job entirely.
Managed hosting options exist that deploy OpenClaw, the open-source AI agent, on dedicated encrypted servers with simplified setup and no sysadmin skills required.
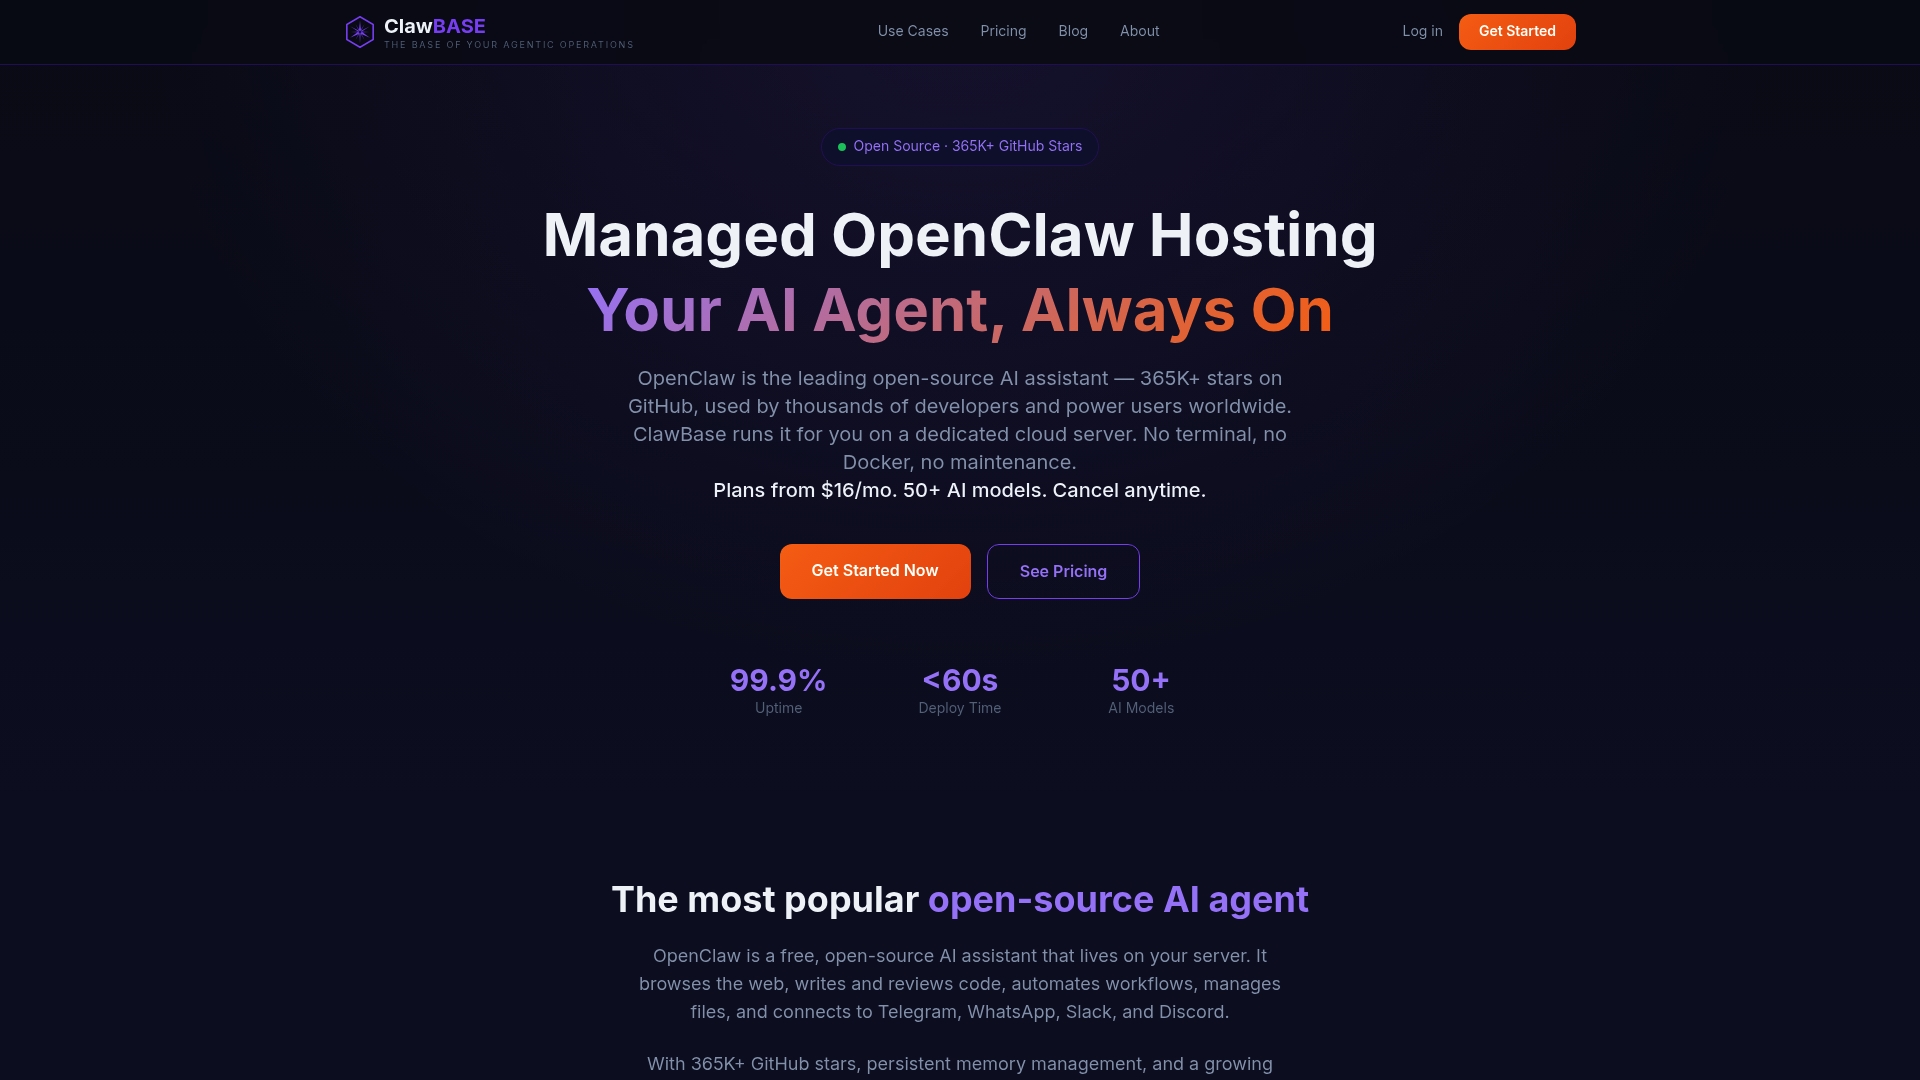
For teams with limited DevOps capacity, privacy-sensitive workloads that need infrastructure under your own control, or anyone who just wants a persistent agent connected to Telegram, Discord, Slack, or WhatsApp without stitching that together themselves, this sidesteps the entire instrumentation conversation.
Check Clawbase's plans and pricing starting at $16 a month, with a 7-day free trial on the entry tier to see whether a managed agent fits your workflow before committing.
Where to Go Deeper on LLM Cost Monitoring
For SDK-level implementation details and span field mapping, Datadog's cost documentation is the most concrete technical reference available. For strategy and expected savings ranges from routing and caching, the Hyperion Consulting cost optimization guide covers monitoring and alerting practices in more depth. For hands-on implementation of semantic caching and token budgets, the LetsBuildSolutions production guide walks through the math. If you want to audit calls across multiple models at once, BabyLoveGrowth's multi-LLM audit tool is worth a look.
Sources
- Cost — Datadog documentation
- LLM cost optimization guide — Hyperion Consulting
- LLM cost optimization in production — LetsBuildSolutions
- LLM cost tracking solution — TrueFoundry
- LLMIntel — cost per app, model & environment