AI Agent Observability: What to Trace, Measure and Fix
2026-10-31

AI agent observability is the practice of recording what an agent did, why it did it, and whether the result was any good. Classic monitoring tells you the process is alive. Observability tells you whether the agent picked the right tool, retrieved the right context and gave an answer you can trust. If you run an agent that acts on its own, you need both.
This guide covers what to capture, which metrics matter, how to keep traces from becoming a privacy problem, and how to start small without buying a platform on day one.
TL;DR
- Agent observability extends logs, metrics and traces with signals about decisions, retrieved context, tool calls and output quality, not just uptime and errors.
- Trace every run end to end: input, plan, each tool call with its arguments and result, each model call, and the final answer.
- Track tokens, latency, error rate and tool-call volume, then add quality, groundedness and safety checks against a baseline.
- Capture less than you think: hash payloads by default and keep full text only where you have a reason and a retention rule.
- Start with one agent, one trace format and one weekly review of failed runs.
Table of Contents
- What AI agent observability actually means
- Why agents fail in ways dashboards miss
- What to capture in every run
- Which AI agent metrics to track
- How to trace a run when it succeeds or fails
- Privacy and security: capture enough, not everything
- From traces to a better agent
- Our perspective: observe first what you can act on
- Run OpenClaw without the infrastructure work
- When to add observability and how to start
- FAQ
- Sources
What AI agent observability actually means
A traditional service is deterministic enough that a healthy dashboard usually means correct behavior. An agent is different. Microsoft's guidance on observability for generative and agentic systems describes it as logs, metrics and traces extended with AI-native signals: retrieval context, tool use, policy choices and output quality. Its core point is that uptime and error rates alone are poor indicators of AI quality, because an agent can be technically healthy while producing incorrect, unsafe or noncompliant results.
IBM frames the same idea around end-to-end behavior: monitoring and understanding everything the agent does, including its interactions with language models and external tools. Splunk's practitioner guide adds a useful distinction from conventional application performance monitoring: structured run telemetry is paired with evaluations that judge whether the behavior was correct.
Standards bodies are catching up too. IEEE SA approved project P4213 on September 25, 2026. It describes an AI-observability framework covering terminology, requirements, telemetry models and lifecycle measurements across model, inference, agent or workflow, retrieval and infrastructure layers. That layering is a handy mental model, and we use it below.
Put simply, you are answering four questions for every run:
- What did the agent try to do?
- What did it actually do, step by step?
- What did it cost in tokens, time and money?
- Was the outcome correct and safe?
Classic monitoring answers the third one and part of the second. The rest is new work.
Why agents fail in ways dashboards miss
Agents use language models to break a goal into subtasks, then reach for tools and memory to finish them. IBM notes that this makes them hard to monitor, and that in multi-agent systems observability helps you find which agent or interaction caused a problem and reveals collective behaviors. Its perspective is that end-to-end tracing is essential, because failure patterns that emerge between agents cannot be located from one component's logs.
The ACM FSE Companion '26 tutorial on agentic AI makes the same case from a software engineering angle. Runtime control flow is generated dynamically and is stochastic, so failures often look like goal drift, unsafe tool use or false success rather than a crash. A false success is the nastiest one: the run ends cleanly, the log says "done," and the file is wrong.
Three failure shapes are worth naming, because each needs a different signal:
- Silent wrong answers. Nothing errors. Only an evaluation of the output catches it.
- Loops and waste. The agent repeats a reasoning or tool step. Token counts and step counts expose it.
- Unsafe actions. The agent follows an injected instruction or touches data it should not. Tool-call arguments and permission records expose it.
AgentSight, a 2025 research paper, reports detecting prompt-injection attacks, resource-wasting reasoning loops and multi-agent coordination bottlenecks, with an average measured runtime overhead of 2.9% across three developer workflows. It is research, not a product spec, but it shows these failures are observable when you look at the right layers.
What to capture in every run
Microsoft's guidance lists the fields worth recording. Turn it into a checklist for your own agent:
- Request identity and timestamps
- Conversation and run identifiers, so you can group turns into one thread
- User inputs and system responses
- Retrieval provenance: which documents or memories were pulled, and from where
- Tool names, arguments, permissions and outputs
- Policy decisions, such as an action that was allowed, blocked or escalated
The key is linkage. Each step belongs in one end-to-end trace, not in five separate log files you have to stitch together at 2 a.m.
For structure, borrow from OpenTelemetry. Microsoft's Waza guide on trace export shows a span hierarchy rooted in an evaluation, then task, turn, tool-call and model-call spans, using GenAI attributes such as model name, input and output tokens, tool name and tool-call ID. You do not need Waza to copy the shape: one parent span per run, one child per model call, one child per tool call.
IEEE P4213 names the agent-level signals you will want on top of that: tool-call tracing, planning transparency, memory utilization and multi-agent execution. Memory deserves special attention in a long-lived assistant. If your agent remembers across sessions, a bad memory can corrupt many future runs, so log what was written and what was recalled. If you run OpenClaw, our write-up on how OpenClaw manages memory explains the layers you would be tracing.

There is also a deeper option. The AgentSight authors argue that application-level intent and system-level effects must be correlated, because watching either one alone leaves a semantic gap between what an agent meant to do and what it did. Their approach uses eBPF boundary tracing to connect intent seen in encrypted traffic with kernel-level effects. Most teams will not start there, but it is a good reason to log tool effects (files written, commands run), not only the model's description of them.
Which AI agent metrics to track
Start with the numbers every platform can give you, then add the ones that judge quality. Microsoft recommends tracking token usage, latency, error rate and request and tool-call volume, then evaluating groundedness, safety or risk, and tool-use correctness.
| Metric group | What to measure | What it tells you |
|---|---|---|
| Cost | Input and output tokens per run, per model | Where spend goes, and whether a cheaper model could do a step |
| Speed | End-to-end latency, latency per tool and model call | Which step makes users wait |
| Reliability | Error rate, retries, timeouts, tool failures | Whether the plumbing holds |
| Volume | Requests, tool calls per run, steps per run | Loops, runaway behavior, load growth |
| Quality | Groundedness, task success, answer helpfulness | Whether the output is right |
| Safety | Blocked actions, policy decisions, injection flags | Whether the agent stays inside its limits |
IBM adds resource use, tool selection, root causes and compliance with ethics and data-protection requirements to the list of things observability should help you evaluate.
Set a baseline, then alert on change
A number without a baseline is trivia. Microsoft recommends establishing behavioral baselines and alerting on deviations from normal. For a personal or team assistant, normal might be "a typical run uses 4 to 8 tool calls and finishes in under a minute." A run with 40 tool calls is worth a look even if it succeeded.
Beware metrics that flatter you
NIST's report on monitoring deployed AI systems, AI 800-4, warns that Goodhart's Law and the streetlight effect can make apparently successful measurement misleading. In plain terms: when a metric becomes a target, the agent (or the team) optimizes the metric, and you only measure what is easy to see. A 98% "task completed" rate means little if completion is self-reported by the agent. NIST also flags drift and performance degradation as hard to detect, including shifts between pre-deployment and post-deployment data. Sample real runs by hand every week and compare them with what your dashboard says.
Cost is a metric too, and it ties directly to model choice. If you route different steps to different models, per-step token data is how you prove it pays off. Our guide to model selection for agents walks through cost per successful task as the number to watch.
How to trace a run when it succeeds or fails
A practical sequence for any agent, whether you built it or host it:
- Assign a run ID at the start and carry it through every model call, tool call and memory access.
- Record the intent. Store the user request and the plan or subtask list the agent produced.
- Wrap each tool call. Log the tool name, arguments, permission used, result and duration.
- Wrap each model call. Log model, token counts, latency and finish reason.
- Log memory and retrieval. Which items were read and which were written.
- Record the outcome and a verdict. Add an automated evaluation or a human label: correct, partly correct, wrong, unsafe.
- Group runs into threads. A multi-turn conversation often fails on turn six because of turn two.
The ACM tutorial recommends exactly this kind of connection: high-level intent, model decisions, tool calls, memory accesses and low-level effects in one trace, supporting both retrospective diagnosis and runtime intervention.
When a run fails, read the trace top-down. Did the plan make sense? Did the first tool call return what the agent expected? Did it misread a result, or did the tool return bad data? Most failures turn out to be one of three things: a bad retrieval, a tool returning something unexpected, or a prompt that left too much room.
If your concern is whether the agent is up at all, that is a related but narrower job. We cover it in agent uptime monitoring and in a 30/60/90 plan to prevent AI agent downtime.
Privacy and security: capture enough, not everything
Full prompts and tool outputs can contain passwords, customer data and private messages. Microsoft's guidance says to balance forensic needs against privacy, data residency, minimization, retention and legal or regulatory obligations, with access controls and encryption aligned to policy and risk.
Waza shows one sensible default. It disables payload capture and instead records SHA-256 hashes and byte lengths for prompts, completions, tool arguments and tool results. Full payloads need an explicit opt-in. With hashes you can still tell that two runs used identical inputs, and you can spot a result that suddenly doubled in size, without storing the content.
A workable policy for a small team:
- Hash payloads by default; keep full text only for flagged or failed runs.
- Set a short retention window and delete on schedule.
- Limit who can read traces, and encrypt them at rest.
- Redact credentials before anything is written.
- Log tool permissions, so you can prove what the agent was allowed to do.
Prompt injection is the security case where traces earn their keep. If your agent browses the web, record which pages it read and what actions followed. Our piece on reducing prompt injection risk in web automation covers the defensive side.
From traces to a better agent
Observability that nobody reads is a storage bill. OpenTelemetry's post on agent observability standards argues that telemetry should feed evaluation tools in a feedback loop that continuously improves agent quality, and that standardizing the format avoids lock-in to a single framework or vendor. The ACM authors push the idea further: traces should support risk tracking, containment, policy checks and human escalation, not just diagnosis.
That last part is where observability turns into operations. When traces show an agent repeatedly trying a blocked action, you want a runtime control that stops it and a person who gets pinged. Teams that deploy AI agents for sales and support face this daily, since an agent talking to customers needs guardrails and an escalation path, not just a log.
A simple improvement loop:
- Pull the 20 worst runs of the week (by cost, by errors, by human rating).
- Label the root cause: retrieval, tool, prompt, model or policy.
- Fix the most common cause first.
- Turn each fixed failure into a regression test.
- Re-run, compare against the baseline, and repeat.
Our perspective: observe first what you can act on
We host OpenClaw agents all day, and our view is practical. Most people running a personal or team assistant do not need a full enterprise telemetry stack. They need to answer three questions fast: is the agent up, what did it just do, and did it do it right?
That is why we separate the layers. Infrastructure health (uptime, backups, updates, memory persistence) should be someone else's problem, which is the point of managed hosting. Behavior (what the agent decided and which tools it touched) is the part only you can judge, because only you know what "right" looks like for your work.
We also think teams over-collect early. A trace you cannot act on is a liability, especially when it holds private data. Begin with run IDs, tool calls and token counts, add one quality check on your highest-stakes task, and grow from there. The NIST observation that long agentic tasks make monitoring costly is a good reason to be selective rather than to log everything forever.
Finally, treat metrics with suspicion until a human has read a sample of real runs. The dashboard says what you chose to measure. The transcript says what happened.
> *— Iosif Peterfi*
Run OpenClaw without the infrastructure work
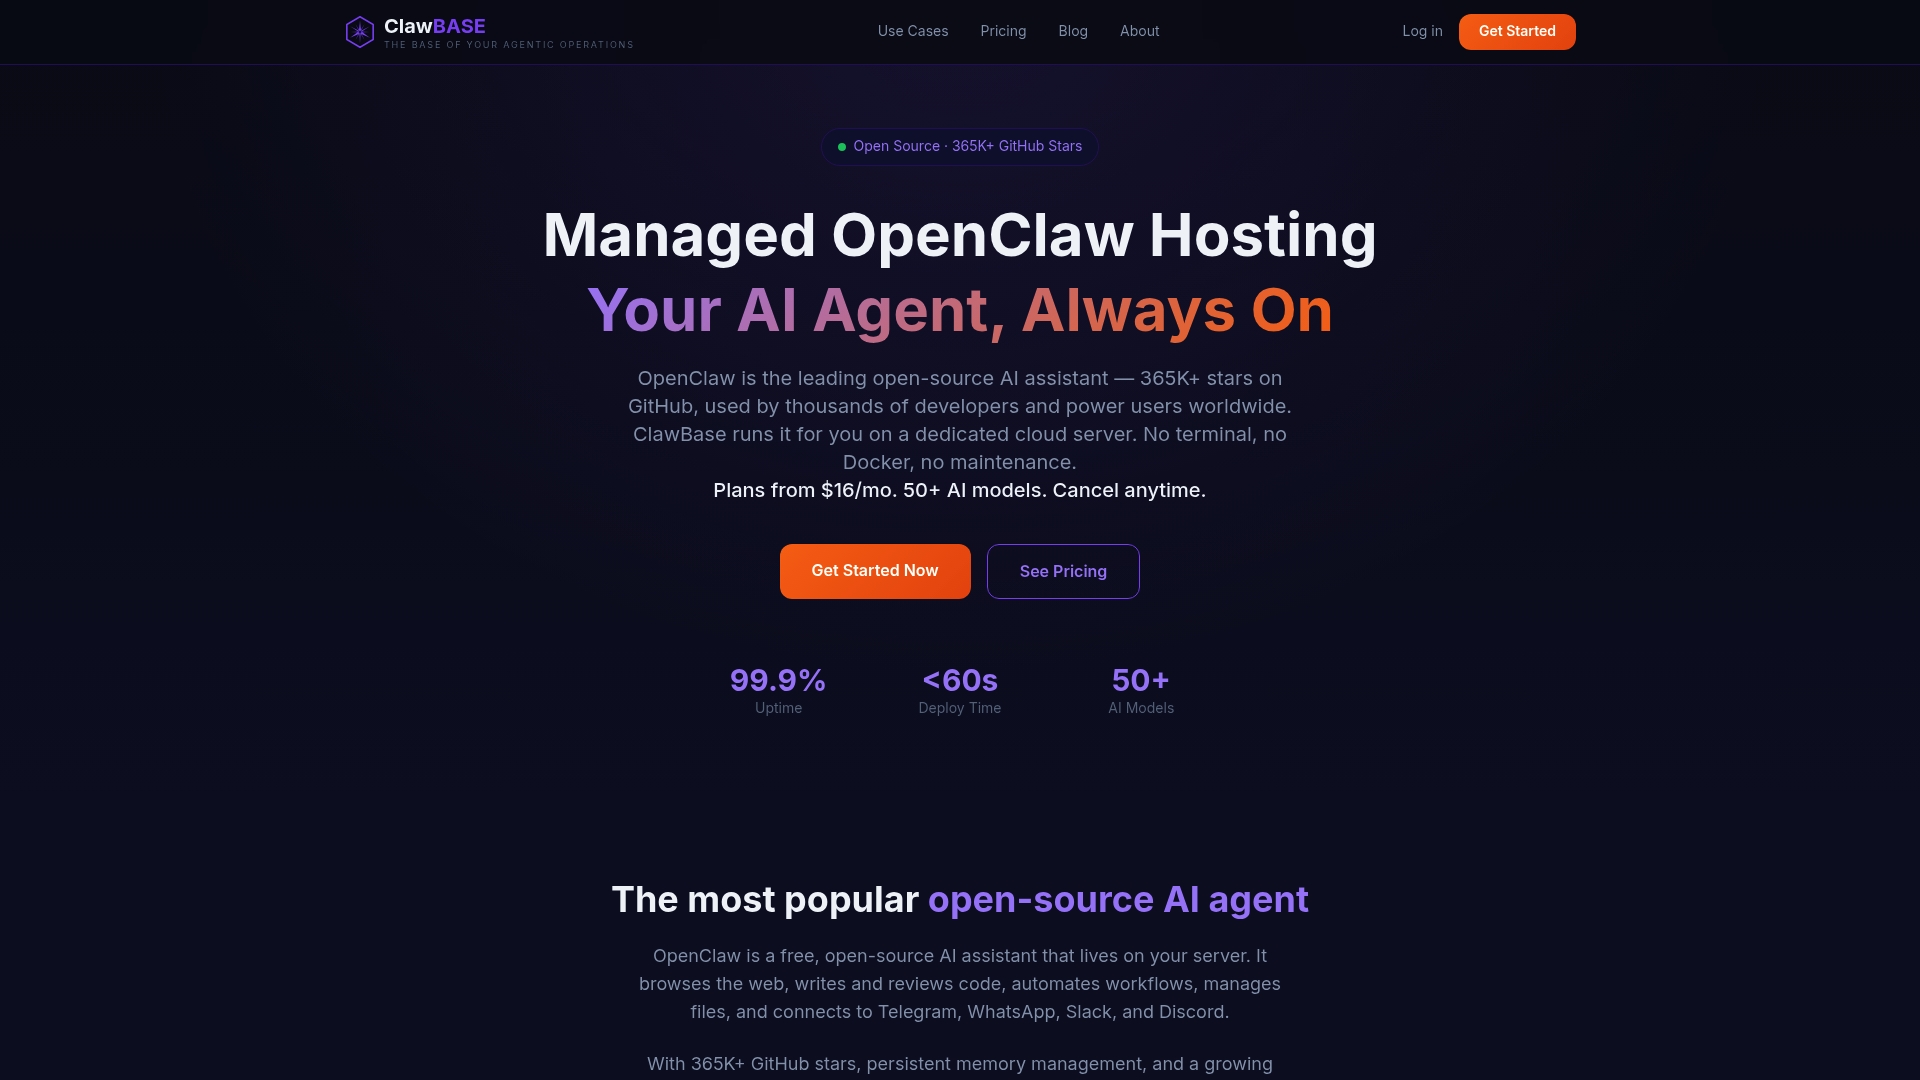
If you want to spend your time on agent behavior rather than servers, ClawBase gives you managed OpenClaw on a dedicated, encrypted cloud server with one-click deployment, 99.9% uptime, persistent memory, daily encrypted backups, automated updates and access to over 50 AI models. You can connect it to Telegram, Discord, Slack and WhatsApp. Plans start at $16 per month for LITE ($199 per year), with PRO at $33 per month ($399 per year) and MAX at $66 per month ($799 per year), and the entry plan includes a 7-day free trial.
See the ClawBase plans and pricing or browse what OpenClaw agents can do before you decide.
When to add observability and how to start
The honest answer is earlier than feels necessary. NIST AI 800-4, drawing on 2025 workshops and a literature review, says post-deployment monitoring is needed to validate reliable real-world operation, to detect unforeseen outputs and drift, and to identify consequences that arise when contexts change. A prototype you run once can live with print statements. An agent that runs unattended, touches files or messages other people needs traces.
NIST also names financial, compute and human-resource requirements as barriers, so scale the effort to the risk:
- Prototype: console logs plus a saved transcript per run.
- Daily personal or team use: run IDs, tool-call logs, token and latency counts, a weekly review of failures.
- Customer-facing or high-stakes: full traces, automated evaluations, baselines with alerts, access controls and a defined escalation path.
To get going this week: pick your single most-used agent workflow, add run IDs, log every tool call, record tokens per run, and read ten transcripts on Friday. If you are building multi-step flows, our developer's guide to agent workflow automation shows where to put the checkpoints. Then choose a standard format such as OpenTelemetry so you can change tools later without losing history.
FAQ
What is the difference between AI agent monitoring and observability?
Monitoring watches known signals such as uptime, errors and latency, and alerts you when they cross a threshold. Observability lets you ask new questions of recorded traces, such as why the agent chose a tool or retrieved a document. For agents you need both, because a healthy system can still give a wrong answer.
Which AI agent metrics matter most to start with?
Begin with token usage, latency, error rate and tool-call volume, since they are cheap to collect. Then add one quality measure for your most important task, such as groundedness or task success judged on a sample. Compare everything against a baseline so deviations stand out.
Do I need OpenTelemetry?
You do not need it on day one, but a standard format helps. OpenTelemetry's authors recommend standardized telemetry to avoid framework or vendor lock-in. If you log run IDs and spans in a compatible shape now, you can plug in analysis tools later.
Is it safe to log prompts and tool outputs?
Only with care. They can contain personal or confidential data, so minimize what you store, set retention limits, encrypt and restrict access. A common default is to store hashes and lengths, and keep full payloads only for flagged runs.
How is observability different when several agents work together?
The failure can sit in the interaction rather than in any one agent, so single-component logs are not enough. You need one end-to-end trace across agents, with run and thread IDs shared between them, to see which handoff went wrong.
Sources
- Observability for Generative AI and agentic AI systems, Microsoft Learn
- IEEE SA P4213
- Why observability is essential for AI agents, IBM
- What Is AI Agent Observability? A Practitioner Guide, Splunk
- Observability and Runtime Governance for Agentic AI Systems, ACM
- AgentSight: System-Level Observability for AI Agents, arXiv
- OpenTelemetry Trace Export, Waza
- Challenges to the monitoring of deployed AI systems, NIST AI 800-4
- AI Agent Observability: Evolving Standards and Best Practices, OpenTelemetry